GEOLOGY MEETS VIRTUAL REALITY:
VRML VISUALIZATION SERVER APPLICATIONS
Geological Institute Albert-Ludwigs-University, Albertstr. 23-B, D-79104 Freiburg im Breisgau, Germany
email: webmaster@perm.geologie.uni-freiburg.de
ABSTRACT
The setup of a VRML visualization server is discussed. The so called VRengine is embedded in a World Wide Web server site accessible by the Internet community. Two geological applications show the advantages of the concept for the visualization of extended data sets. Model specific HTML forms and clickable image maps are provided to build up a visualization request. On the server site a VRML scene is generated by a CGI program using the Visualization Toolkit. To render the scene on the client site VRML plugins are available on most platforms. In addition to the visualization server concept, a short overview about the applied methods of geometric modeling is given.
Keywords: Visualization server, geometric modeling, VRML, HTML, CGI, vtk, Visualization Toolkit, Geo3View, geology, silver mine, sandbox experiment
INTRODUCTION
For several years we developed programs to visualize geological structures. A lot of time was spent trying to cross system borders. Time that was missing on processing geology related topics. Using Mesa-Lib(1) (OpenGL everywhere) helps a lot to share our visualization program system Geo3View [Klein91], [Linde95] with people using different workstations. Exchanging only the results using the Virtual Reality Modeling Language (VRML) broke down every border. Here we want to discuss our implementation of the visualization server concept(2). This project is named VRengine. It is based on the Visualization Toolkit (vtk) [Schro96]. Vtk is an extensive class library for computer graphics and visualization. It is written in C++ and has an additional binding to the Tcl language. Two geological applications are used to explain the VRengine: A virtual silver mine and a sandbox experiment, both developed in the Geo3View environment. The applied techniques of geometric modeling are shown.
THE VISUALIZATION SERVER VRENGINE
VRengine establishes an interface to our geometric
models in the World Wide Web (WWW). These
models are boundary represented and built by triangle
meshes. Single meshes or groups of related meshes
are stored in geometry files. Combining the geometry
files of one data set may result in a VRML file with
more than 1 MByte. So the download would not be
too convenient and the visualization not very
dynamic. The server concept allows an individual
selection of a subset of the model. The selection is
processed by a Common Gateway Interface (CGI)
program, which reads the meshes and exports them
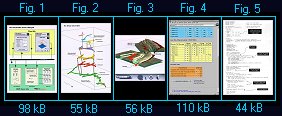
into one VRML file (Fig. 1). This file is sent to where
it has been requested from. Before describing the
server details, a short introduction to the data sets of
the geological applications is given:
| Fig. 1: Schematic diagram showing data exchange between a client and the visualization server. The silvermine application is used as an example. Upper left: User interface to generate the visualization request. Upper right: Client with activated VRML Plugin after receiving the graphic scene. Lower box: Components of VRengine on the web server site |
The virtual silver mine
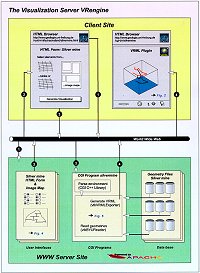
One of the objects to visualize is a silver mine in the Black Forest [Gante95a], [Gante95b], [Linde95], [Linde96]. The mine is quite complex. Nearly 25 km of galleries and shafts are reconstructed using modeling tools from the Geo3View package. Several steps are performed to set up the model. First a set of nearly 70 maps was analyzed. Different maps had been created during the long history of the mining activities. To prepare a consistent model the galleries are redrawn from the maps and digitized in a new coordinate system [Gante95a]. To generate triangle meshes of the boundary surfaces, several tools were developed [Linde95]. These allow the tesselation of lists of point pairs along the border of the galleries. The shafts were constructed between polygon shapes on the different levels of the mine. The galleries were split into simple parts between the branching points. Additional elements are fault zone boundaries and approximated geometries of the ore bodies. The map includes symbols depicting the orientation of fractures and sills, measured by geologists (quadratic plates in Fig. 2). Rendering these planes together with the galleries is a new way of visualizing the geological structure of an area. The geometry data set now includes triangle meshes containing:
In the Geo3View model each triangle mesh is stored
in one geometry file. The file name refers to the
location in the mine. To prepare the virtual silver mine
as an application to the VRML visualization server
this complex segmentation has been simplified. All
meshes are combined in groups in respect to the
different mining levels. Vtk is used to store related
meshes in combined geometry files. These files build
the geometry data base of VRengine, which serves the
requests to the silver mine.
| Fig. 2: Visualization of the upper part of the silver mine. The mine is located near Freiburg (SW-Germany) in the Black Forest mountains. The subvolume shows the galleries above the so called Kappler Stollen. The bounding box is 800 m long, 400 m wide and 420 m high. |
The Sandbox Experiment
The second geological data set represents the final
stage of a tectonic sandbox experiment [Ebert95].
Physical simulations are used to prove theories about
long term deformation processes in the earth crust.
The experiment mentioned here focused on the
collision of three continental plates. In the model
different crustal layers are represented by colored
sand. To investigate the internal deformation style, the
deformed sand body has been cut into slices. To
reconstruct the spatial relationships a geometric model
is developed. Layers and fault boundaries were
digitized from the sketched slices. Shape blending
techniques were used to interpolate intermediate slices
[LindeXX]. The surface of selected layers and faults
is reconstructed by triangulation between the slices.
The derived data set is a boundary represented
geometric model of the deformed sand body. The
triangulation program of the Geo3View package
stores the meshes as geometry files. The resulting
geometry data set consists of a stack of deformed
layers, disrupted along deformed fault planes. The
VRengine allows the combination of layers and faults
in one VRML scene. Therefore, the server interface
provides a HTML form and clickable image maps.
The requested subset of meshes is sent to the client's
browser, where a VRML viewer is used to visualize
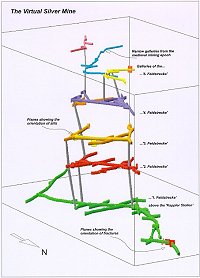
the scene. Fig. 3 shows a VRML scene including two
selected layers and the fault planes.
| Fig. 3: Visualization of the sandbox model. Two layers and the fault planes are selected. The experiment focused on the development of the transpressional Ribeira Belt in south-eastern Brazil (3). |
ELEMENTS OF VRENGINE
The visualization server is implemented on an Apache(4) web server running on a UNIX host. VRengine is built of several components, which are related to one of the following topics:
Fig. 1 shows these components and the data flow schematically. The three groups are sketched as a stack of cards, corresponding to their model specific contents (here the virtual silver mine).
The User Interface
The first step to generate a visualization is a HTTP
request to get the model specific user interface. The
discussion of the interface is based on the silver mine
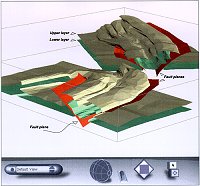
application. One part of this interface is shown in Fig.
4. Two methods for the selection of elements are
implemented: (1) Visual selection can take place on an
image map. This approach is used to select larger units
like the upper part of the silver mine. (2) Tables with
radio buttons are provided for a more detailed
selection.
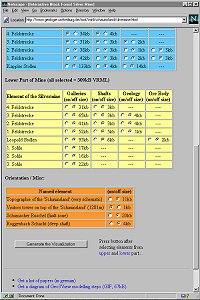
| Fig. 4: User interface to the virtual silver mine. Displayed is the lower part of the HTML form. The radio buttons are used to select different elements. |
The HTML form of the silver mine interface includes tables corresponding to the upper and lower part of the mine. Table rows represent the different levels of the mine. The columns separate various element types: galleries, shafts and the planes of fractures and sills. A third table refers to additional elements of the model like orientation points or the topography. A button is used to start the request for a visualization including only the marked elements.
The CGI Programs
A model specific CGI program is invoked by the
interface. In the example session, the program
silvermine is bound to the 'generate button' of the
HTML form. Fig. 5 shows the program code with
some comments. It is written in C++. The
communication between the program and the calling
interface is based on the CGI environment. All
elements of the HTML form are defined in this
environment. The program uses functions of the C++
CGI Library(5) to parse the environment. All accessible
parts of the mine are listed in an array of elements
(Fig. 5). The names of these elements match the
names of the radio buttons in the HTML form. Using
this name convention, the state of each radio button
can be accessed by a simple function call. If the radio
button is marked, the name of the element is used to
identify the corresponding geometry mesh file. Vtk
methods are used to read the mesh and add it as an
actor to the scene. An individual color is set to the
actor using the entries from the element list. If the
loop has passed all elements of the list, the resulting
scene is exported as a VRML file. While sending the
VRML scene to the client's browser, the VRML
header is exchanged. A predefined header is sent to
provide some model specific viewpoints and lights.
| Fig. 5: Source code of the CGI program used within the silver mine application. |
The data base
Each model has a data base consisting of a set of geometry files, stored in MOVIE.BYU display format [Chris86]. This format is used in the Geo3View system to save geometric models as sets of single mesh files. For the visualization server purpose, the meshes are grouped into larger entities. Shell scripts written in Tcl are used to generate the different files by using the methods of vtkBYUReader and vtkBYUWriter classes. The grouped files are used by the CGI programs to generate the VRML scenes.
RESUME
The virtual silver mine is developed to provide a more natural way to investigate space relationships inside the mine. Geologists doing research on water flow paths [Linde96] or on the nature of basement rocks can use VRengine in addition to the maps to get a three-dimensional impression of the mining area. The model also provides a good frame for other fields of interest, for example archaeology. In 1997 a small part of the mine was re-opened for visitors. The virtual silver mine application is a good starting point for people who want to prepare - or retrace - a visit.
The sandbox application interfaces a different field of geological research. The physical experiment took place in Brazil, the geometric model was prepared in Germany. The visualization server simplifies the exchange of information about the experiment and allows a vivid discussion of the model by the distant research groups. It is also used to demonstrate the results to related working groups who are not necessarily familiar with the applied methods.
Work in progress and future vision
At this time we are extending the functionality of VRengine, using methods of vtk. First tests on applying an algorithm to reduce the number of triangles [Schro92] were successful. The meshes can be reduced using the methods of the vtkDecimate(6) class. The interfaces will be extended by an option to set different parameters for the reduction. Using this option enhances the access to the generated VRML scenes significantly.
Beside this work already in progress we think about the extended possibilities of VRML 2.0. Using script nodes to invoke executable code, will open another way to navigate through the models. Perhaps once we will be guided by a robot [Greha97], who is programmed with model specific knowledge. So we can follow him along flow paths of water, or on his way to points of special interest.
ACKNOWLEDGEMENTS
First we would like to thank Will Schroeder, Ken Martin and Bill Lorensen for providing the Visualization Toolkit. This really great piece of software is very well supported by their Web server site, a mailing list and their textbook [Schro96]. There are lots of other useful things like Apache, Mesa, Glut and the GNU suite we are using from the Internet community. Thanks to all of them.
REFERENCES
Christiansen,H: MOVIE.BYU training
text.- Provo, Utah, Community Press, 300 p.,
1986
Ebert,H, Neves,M, Hasui,Y, Lopes,J,
Guerra,M: Compartimentacão crustal e evolucão cinemática da Província Mantiqueira através de modelagem fisica.- 5. Simp. Nac. Estudos Tectônicos, Bol. Resumos Expandidos,
Gramado-RS, SBG-RS, São Paulo, pp. 26-28,
1995
Ganter,S: 3D-Modellierung der Grube
Schauinsland, Südschwarzwald.- 80 pp.,
unveröffentlichte Diplomarbeit, Geol. Inst.
Univ. Freiburg, 1995
Ganter,S, Lindenbeck,C, Pflug,R,
Ulmer,H: Geometrische Modellierung der
Grube Schauinsland bei Freiburg im Breisgau.- Schriftenreihe des BDG, 14, pp. 101-103, 1995
Grehan,R: Write Cosmic Code.- Byte, 8,
22, pp. 113-114, 1997
Klein,H, Ramshorn,C: 3D-Computergraphik zum Visualisieren von geologischen
Strukturen und simulierten geologischen Prozessen.- 140 pp. + 43 pp. Anhang, Dissertation Geowiss. Fakultät Universität Freiburg,
1991
Lindenbeck,C, Ulmer,H: Entwicklung und
Anwendung von Computerprogrammen zur
Visualisierung geologischer Strukturen und
Prozesse.- Freiburger Geowissenschaftliche
Beiträge, 9, 280 pp., 1995
Lindenbeck,C, Wirsing,G: Hydrogeologische Untersuchungsergebnisse und 3D-Visualisierung des Grubengebäudes Schauinsland.- Arbeitshefte Geologie, Hannover, 1, pp.
60-65, 1996
Lindenbeck,C, Ulmer,H, Ebert,D,
Pflug,R: Geometric Modeling and Visualization of a Sandbox-Experiment: Transpressional Tectonics in the Precambrian Ribeira-Belt (SE-Brazil).- Zentralblatt für Geologie
und Paläontologie, in press
| Mesa rendering library developed by Brian Paul ( http://www.mesa3d.org/intro.html) | |
| see Ken Martins page: "Make your own VRML server using vtk" (http://www.cs.rpi.edu/~martink/vtkData/vtkMakeVis.html) | |
| For geological details see: http://www.geologie.uni-freiburg.de/root/people/ulmer/sbox/sbox_cgi.html | |
| APAtCHy server: http://www.apache.de | |
| By Andrew C. Schwabe: http://www.iexp.com/iexp/products/cgi-lib/ | |
| see http://www.cs.rpi.edu/~martink/vtkData/manhtml/vtkDecimate.html |
Webpage created by Ch. Lindenbeck & H. Ulmer